¶ Introduction to the Ultra Low Latency
In LED display systems, frame latency is defined as the difference between the time when the LED display system receives the video signal and the time the image displays on the LED screen. In other words, if the LED processor receives a video signal at time T1 and the image is displayed on the LED screen at time T2, the system frame latency can be calculated as the difference between T2 and T1 (Latency=T2-T1).
As shown in the figure, the LED display system can be summarized as follows: the video signal (such as from a computer, camera, video processor, or media server) is connected to the LED processor through interfaces such as HDMI, DP, or SDI. Then, the LED processor transmits the video signal to the receiving card inside the LED cabinet through an Ethernet cable. The receiving card further transmits the signal to the driver IC of the LED module, thereby driving each pixel to display the image.
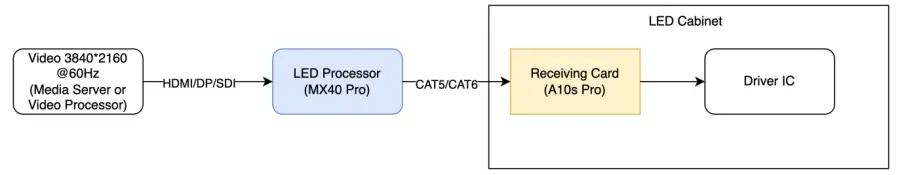
Therefore, the system consists of four key components: video signal, LED processor, LED receiving card, and driver IC. The latency of the entire system originates from these three components: the LED processor, receiving card, and driver IC. At the same time, the fiber converter and cable do not affect the system latency. The detailed parameters for COEX ultra low latency mode are as follows:
- LED processor (0-2 frame latency)
a) 0 frame latency
When ultra low latency is enabled in send-only controller mode, the latency through the LED processor is only 12 rows (at 3840*2160@60Hz is 0.53 milliseconds).
b) 1 frame latency
When ultra low latency is not enabled in send-only controller mode, the latency of the LED processor is 1 frame.
When ultra low latency is enabled in all-in-one controller mode, the latency of the LED processor is 1 frame.
c) 2 frame latency
When ultra low latency is not enabled in all-in-one controller mode, the latency of the LED processor is 2 frames.
- Receiving card (inherent 1 frame latency)
After the video passes through the receiving card, there will be an inherent 1 frame latency.
- Driver IC (inherent 1 frame latency)
The commonly used PWM driver ICs have 1 frame latency in video signals due to internal SRAM storage.
Therefore, the LED system latency = LED processor latency + receiving card latency + driver IC latency
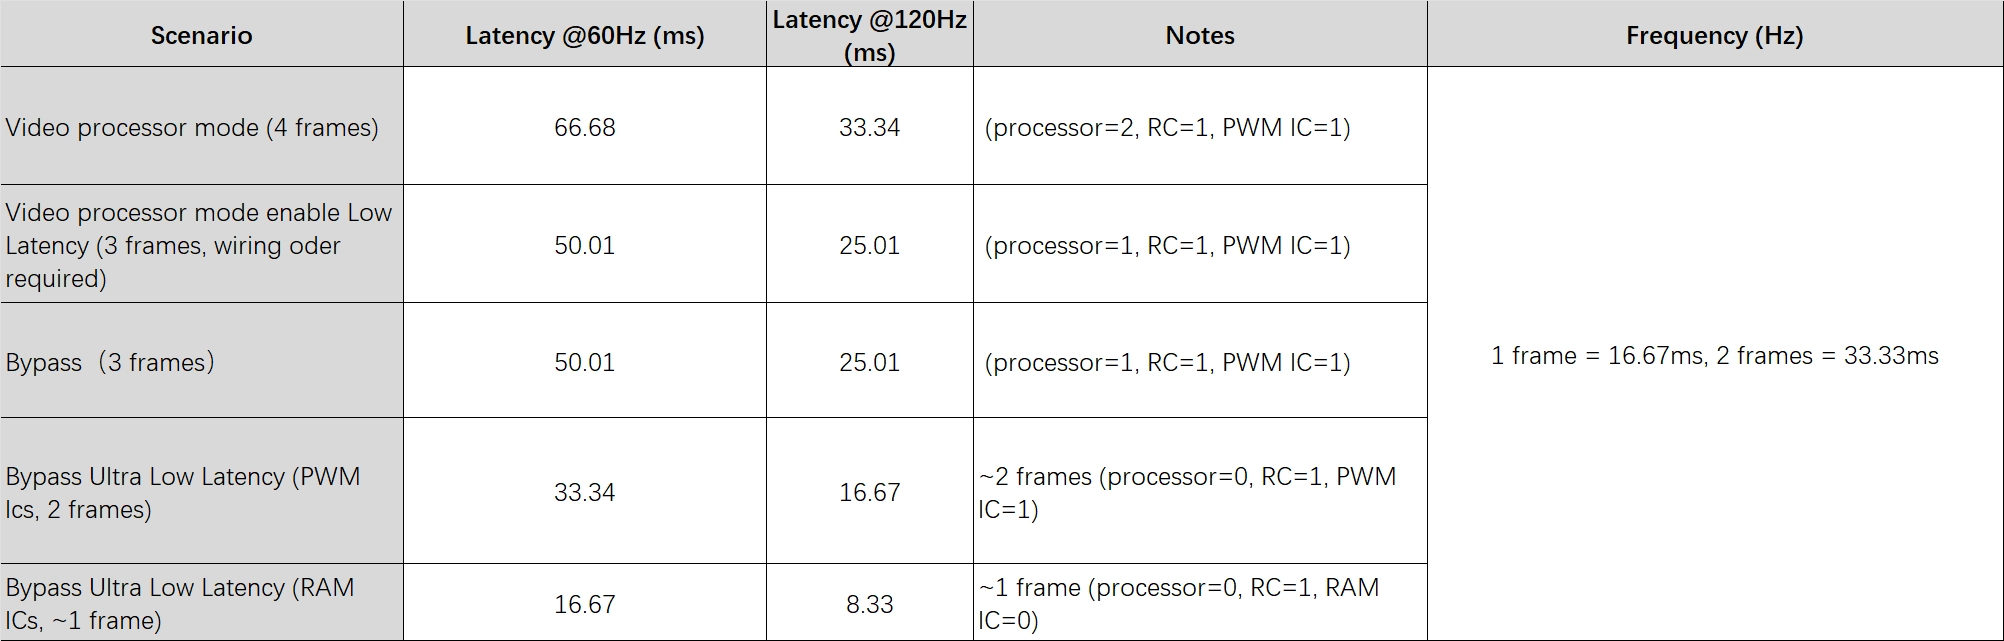
The minimum latency for other mainstream LED processors in the current market is 1 frame, plus the inherent 1 frame latency of the receiving card and driver IC, the latency for the entire LED control system is 3 frames or more.
However, the COEX series of LED processors can already achieve ultra low latency, with a latency of less than 1 ms, and support row-level input-output synchronization. At the same time, combined with the use of built-in RAM driver ICs on the LED modules, the latency of the entire system can be reduced to as low as 2 frames.
Note:
There are generally two description types of low latency in the industry, which are milliseconds (ms) and frames (frames). In the case of a known frame rate, the two units can be converted to each other.
Taking a frame rate of 60Hz as an example, the corresponding milliseconds(ms) of each frame (1 frame) is 1/60×1000, which can be approximated as 16.67ms. In the same way, at 120Hz, the corresponding milliseconds(ms) of a frame(1 frame) are 1/120×1000, which is about 8.33ms.
¶ Functional Limitations
The latency on the LED processor side is mainly caused by processing time, while the ultra low latency mode reduces the processing time from 1 frame or more to 12 rows of pixels in the video concept. Due to the reduction of processing time, the enabling of this function has high requirements for the wiring of the cabinet to ensure the display effect.
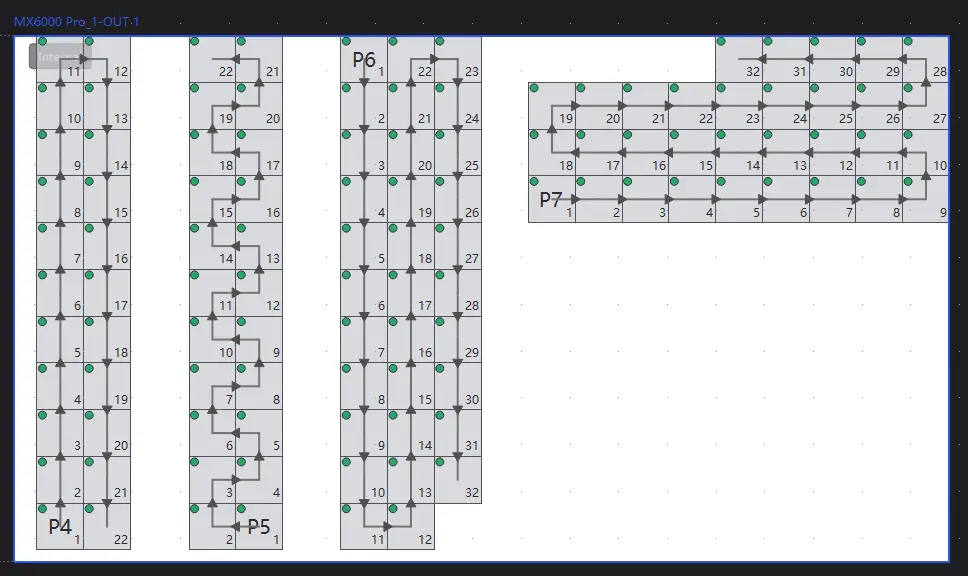
In practical project configurations, it is recommended to adopt the six common low-latency layout approaches illustrated in the figure below. All these layout methods shown in the diagram can effectively activate the low-latency function without reducing the Ethernet port loading capacity.
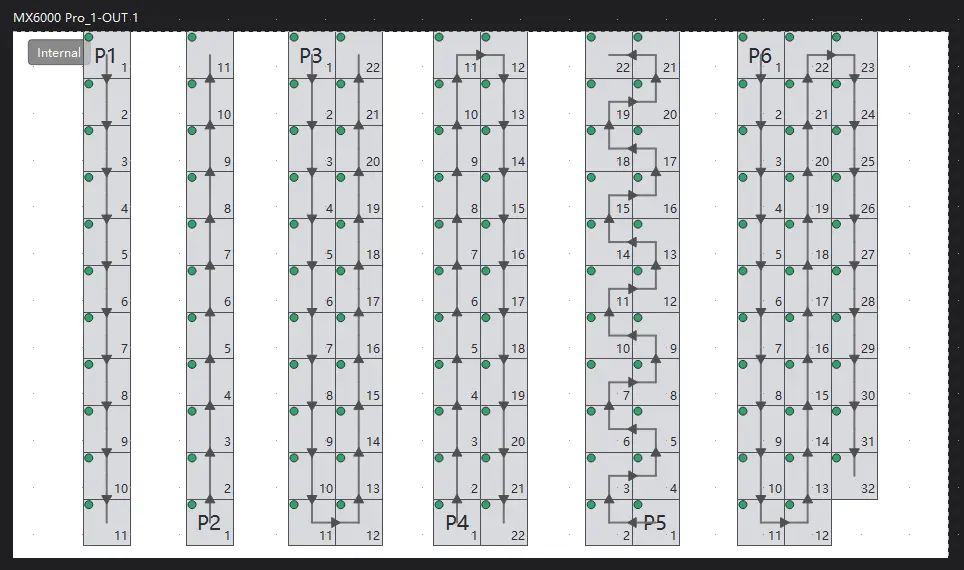
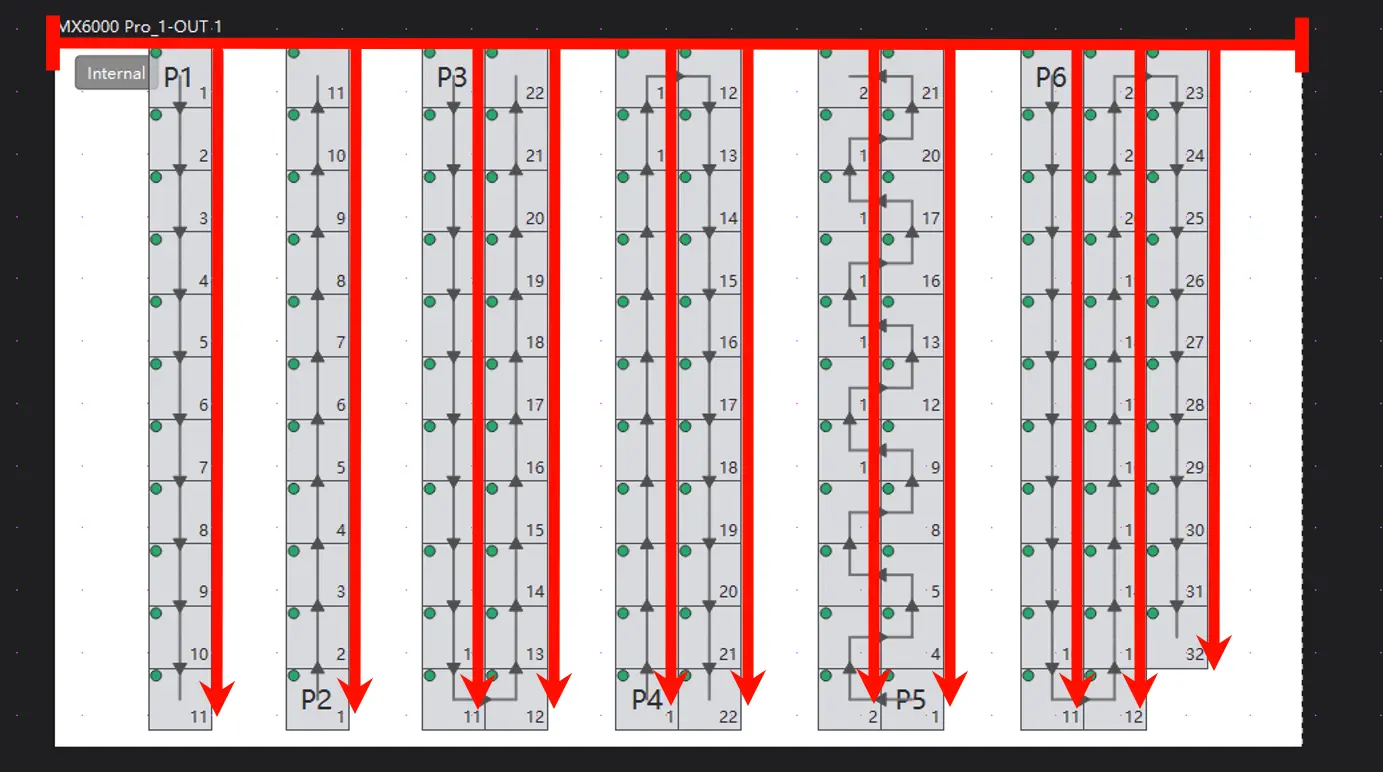
This is because the low-latency function inherently calculates the theoretical loading area of every single Ethernet port vertically from the top of the screen downward.
The layouts shown in the figure above ensure that each vertical column of cabinets is seamlessly aligned with the screen's top edge, thereby preserving the effective loading capacity of all Ethernet ports without any reduction.
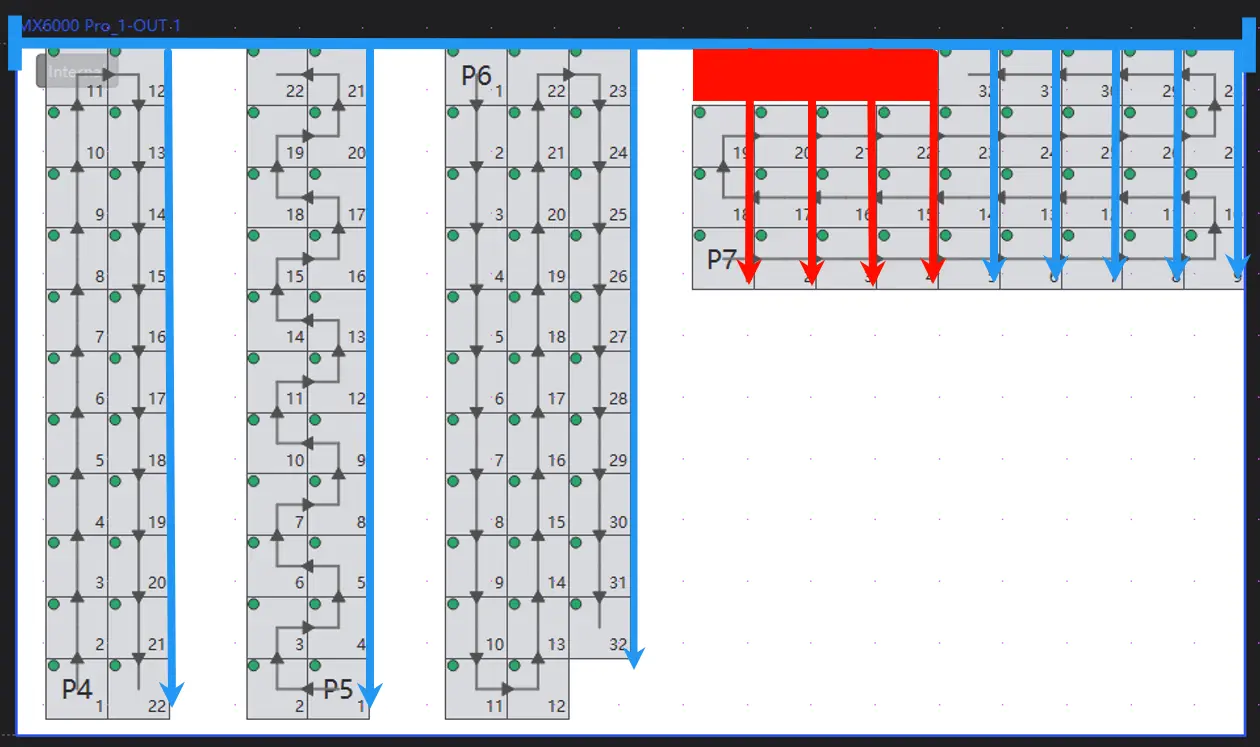
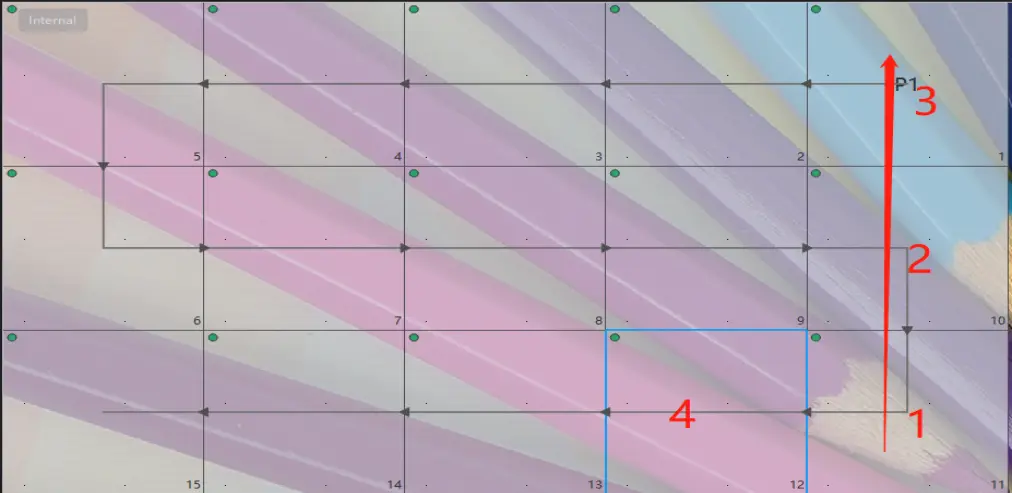
As shown in the P7 Ethernet port layout in the figure below, when the low-latency function is enabled, all Ethernet ports default to calculate their effective loading areas from the screen’s top edge. However, since some cabinets are positioned at a certain distance from the screen top, the red square area in the P7 layout (where no cabinets are placed) is still included in the theoretical loading pixels of the port. Consequently, all pixels within the red area will be wasted once the low-latency function is activated.
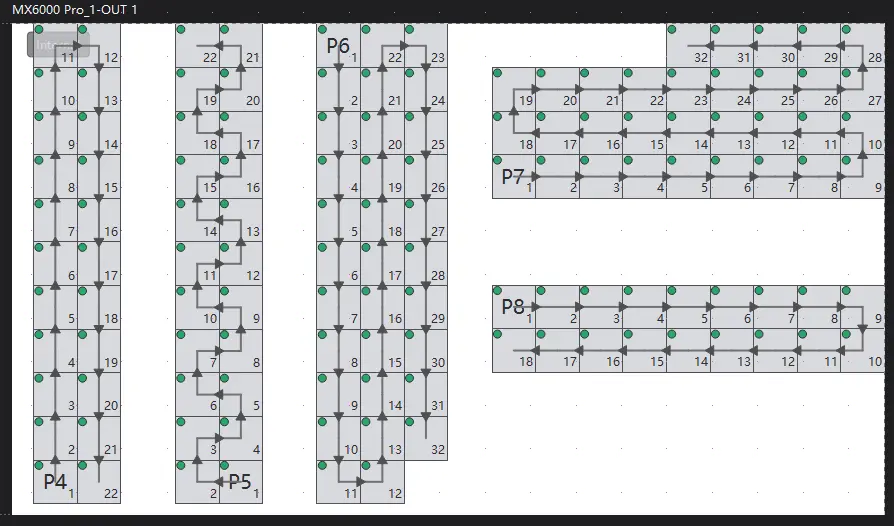
Similarly, when cabinets layout of Ethernet port P8 as shown in the figure below, since the loading of each Ethernet port is independently calculated, the theoretical pixel loading for port P8 under the low-latency function must still include the red area in the diagram — even if there are other cabinets from adjacent Ethernet ports between the P8 components and the screen top. As a result, the pixels in this red area cannot be effectively utilized by port P8 and will still be wasted.
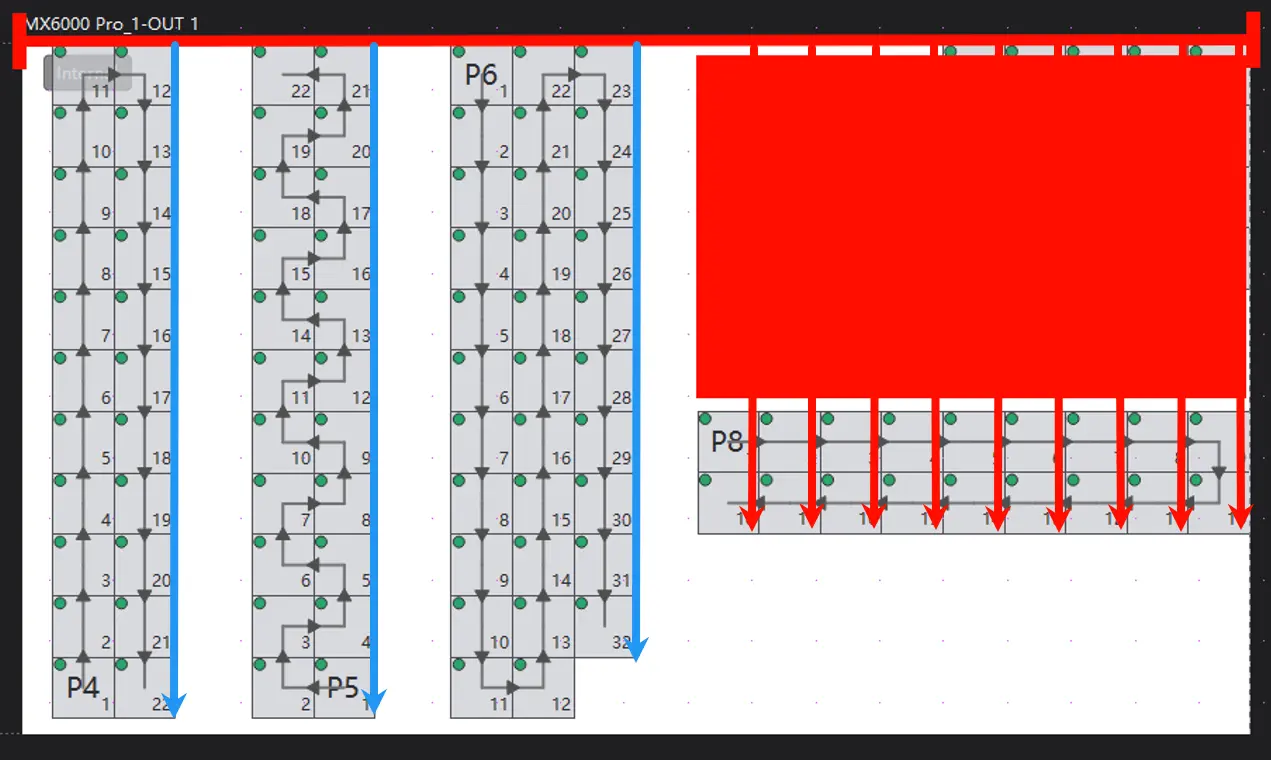
Consequently, enabling the low-latency function will result in the complete waste of loading capacity across all pixel regions between the P8 Ethernet port components and the screen top. This may further lead to flickering in the P8 port's cabinet display due to potential overloading.
Additionally, the current low-latency function only supports a continuous cabinet layout. If you require non-continuous layouts (as shown in the figure below), please contact Novastar’s sales or FAE teams.
Finally, the low-latency function has compatibility limitations with other functions. Specifically, it cannot be activated concurrently with Genlock, 3D, or frequency and frame multiplication functions. Special attention must be paid to the related project configuration.
- For more information about function compatibility, please refer Feature Introduction Page, Features Compatibility Part.
¶ Problem Description
As mentioned above, the cabinet coordinates under different Ethernet ports may impact the loading capacity of that Ethernet port.
In Nova LCT software, the starting point of the screen coordinates in the screen connection interface is consistent with that of the cabinet coordinates by default, and the special setting of the cabinet starting coordinate offset is rarely applied. Therefore, in LCT software, when the ultra low latency function is enabled, the top of the screen and the top of the cabinet are aligned by default, and there is rarely a situation where the cabinet coordinates move. In this case, after enabling the low latency function, the decrease in Ethernet port loading capacity, which causes abnormal display, rarely occurs.
In VMP software, the LED control system has the concept of a canvas, and users can freely move the cabinet on the canvas through simple mouse dragging, most customers will adjust the cabinets layout through this operation. However, at this time, due to the movement of the cabinet coordinates, the loading capacity on the Ethernet port decreases when the ultra low latency mode is enabled, which may cause abnormal display in some cases.
Based on the above situation, this document will introduce the relation between the cabinet coordinates of the Ethernet port and the Ethernet port loading capacity in ultra low latency mode in the COEX system and provide a formula for Ethernet port loading capacity calculation. This document aims to be helpful for early solution designs and ensuring the correctness of ultra low latency solution delivery.
¶ Case Analysis
The customer enabled the ultra low latency mode while free wiring, resulting in screen flickering in some cabinets.
The customer uses 200*200 cabinets with a 5*3 layout. At 60 Hz and 8-bit, the maximum loading capacity of a single Ethernet port is 16 cabinets, and the Ethernet port tends to be fully loaded at this time.
When the low latency mode is turned on, as long as the upper edge of the cabinets is aligned with that of the canvas, any free wiring will not cause any display problems.
However, if the cabinets are moved away from the top of the screen, some cabinets will start flickering. And through testing, it is known that the more the Y coordinate of the cabinet is offset (i.e., the lower the position of the cabinet on the screen), the more cabinets will have flickering issues.
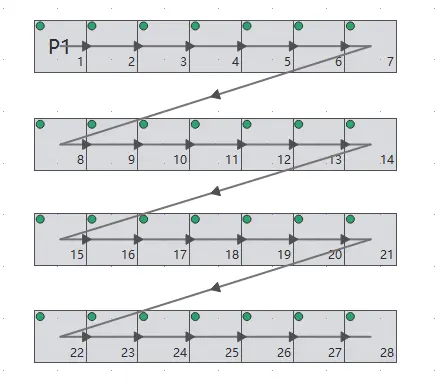
The abnormal phenomenon is described as an increase in the overall Y-axis offset of the cabinet under a single Ethernet port, and the cabinets gradually see flickering issues with the numbers 1-2-3-4 in the following figure.
After turning off the ultra low latency mode, the flickering issues disappear. Therefore, it can be known that in ultra low latency mode, the offset of the Y coordinate of the cabinet will affect the loading capacity under every single Ethernet port.
¶ Loading Capacity Calculation Formula
Although the loading capacity varies at different frame rates and bit depths, in ultra low latency mode, the calculation formula for 1 Ethernet port loading capacity is:
(1- (Y/H)) * TOTAL
In this case, Y is the minimum value of the vertical coordinates of all cabinets under a single Ethernet port.
H is the total pixel vertical axis of the current canvas.
TOTAL is the maximum loading capacity of a single Ethernet port in the regular mode without enabling any additional functions.
Note:
The maximum loading capacity TOTAL in single Ethernet port regular mode is determined by the type of device used. For 1G devices, it is 659722, and for 5G devices, it is 2951200. Please refer to the device specifications for details.
¶ Calculation Explanation
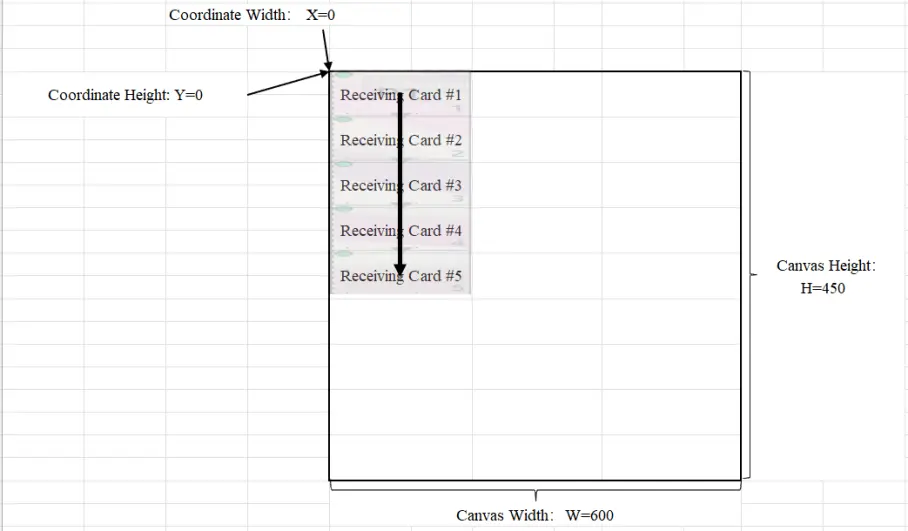
1) As shown in the figure, when Y=0, X=0, H=450
The maximum loading capacity of a single Ethernet port in ultra low latency mode is
(1- (Y/H)) * TOTAL=(1- (0/H)) * TOTAL=(1-0) * TOTAL=TOTAL.
In other words, in ultra low latency mode, when any cabinet of the Ethernet port is parallel to the upper edge of the canvas, the loading capacity of the Ethernet port will not decrease.
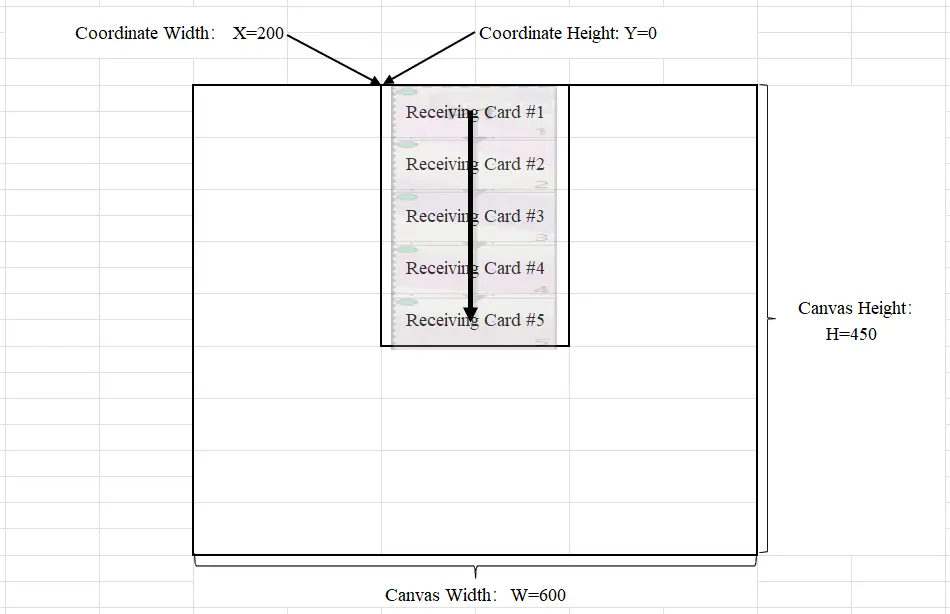
2) As shown in the figure, when Y=0, X=200, H=450
In ultra low latency mode, the loading capacity of a single Ethernet port is
(1- (Y/H)) * TOTAL=(1- (0/H)) * TOTAL=(1-0) * TOTAL=TOTAL.
That is to say, in real scenarios, any change in the X coordinate of the cabinet and any left or right movement of the cabinet will not have any impact on the Ethernet port loading capacity in ultra low latency mode.
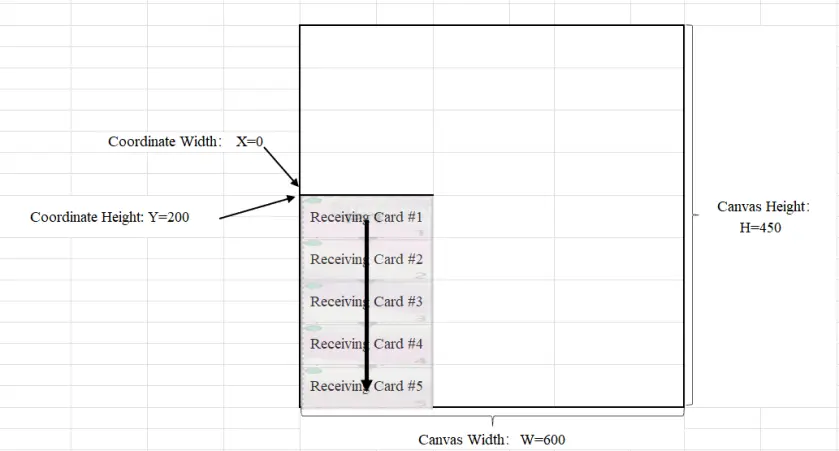
3) As shown in the figure, when Y=200, X=0, and H=450,
In ultra low latency mode, the loading capacity on the single Ethernet port is
(1- (Y/H)) * TOTAL=(1- (200/450)) * TOTAL=(1-4/9) * TOTAL=5/9 * TOTAL.
Note:
After enabling the ultra low latency effect, moving the cabinet coordinates will cause a decrease in the loading capacity of the Ethernet port. The following section is the calculation method for an Ethernet port loading capacity and cabinet coordinates in ultra low latency mode during free wiring.
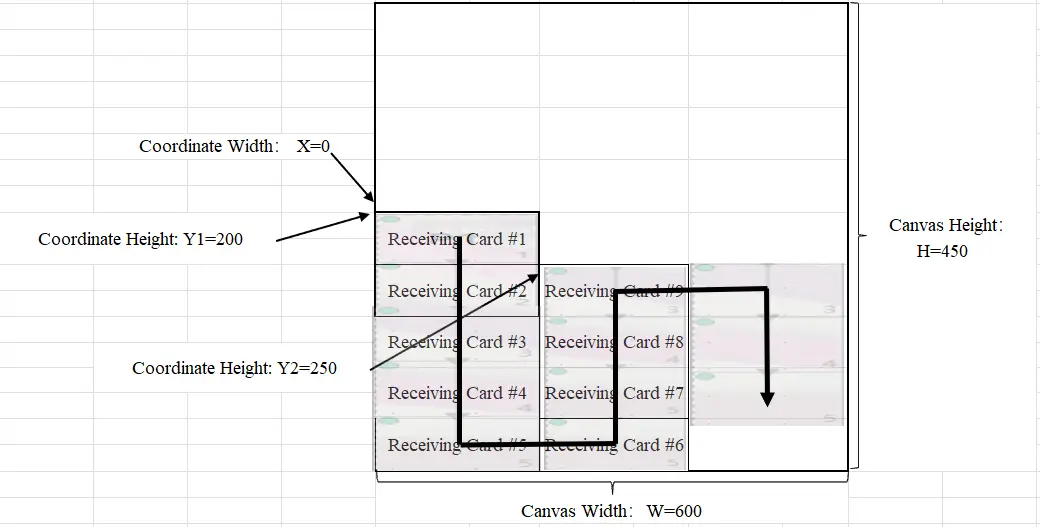
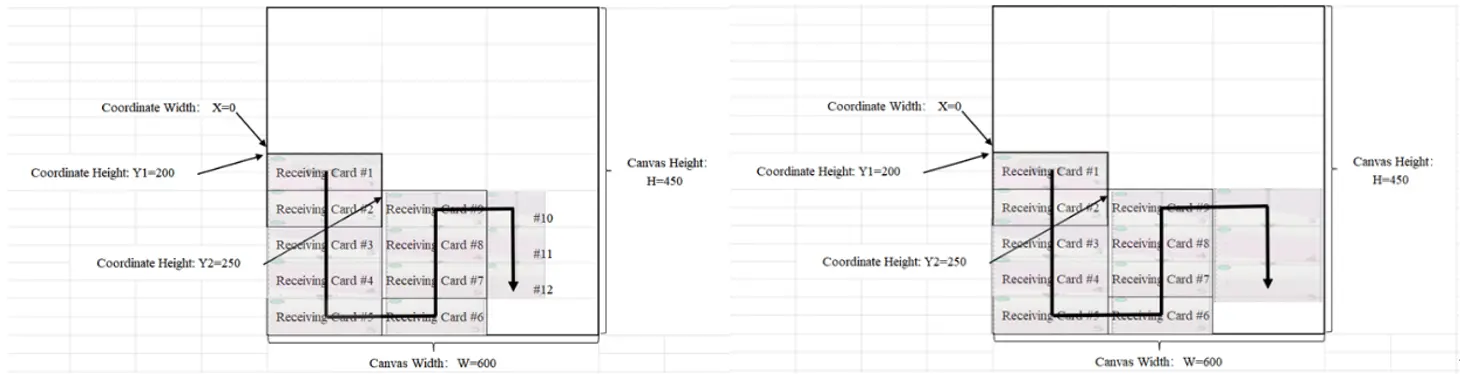
As shown in the figure, when Y1=200, Y2=250, and H=450,
There are multiple different cabinet coordinates under a single Ethernet port, and the smallest cabinet coordinate needs to be substituted into the formula for calculation.
Since (Y1=200)<(Y2=250), the Y value introduced into the calculation formula is 200.
Therefore, we can obtain:
In ultra low latency mode, the loading capacity of a single Ethernet port is
(1- (Y/H)) * TOTAL=(1- (200/450)) * TOTAL=(1-4/9) * TOTAL=5/9 * TOTAL
Therefore, in ultra low latency mode, the maximum loading capacity of a single Ethernet port is only related to the minimum Y coordinate of the cabinet it is connected to.
4) Mixed Cabinets on a Single Ethernet Port
Due to the complexity of the project, it is possible that different cabinets may be connected under a single Ethernet port.
In this case, if the low-latency function is enabled, the user not only needs to calculate the impact of coordinate offset on the load of the Ethernet port through the above calculation formula but also needs to unify the cabinet specifications to the maximum resolution size connected under every Ethernet port and then calculate the loading.
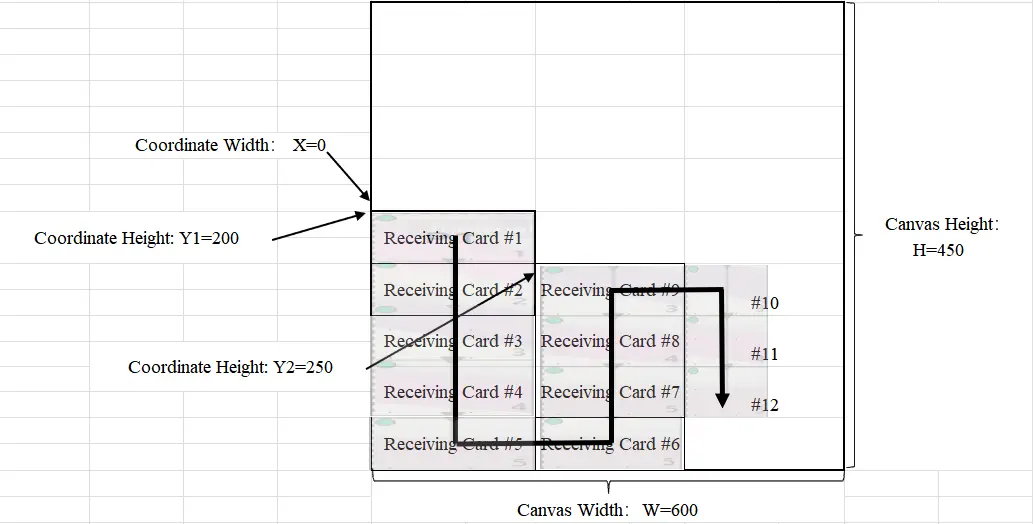
As shown in the figure, when Y1=200, Y2=250, and H=450, based on the above calculations, in ultra low latency mode, the loading capacity of a single Ethernet port is
(1- (Y/H)) * TOTAL=(1- (200/450)) * TOTAL=(1-4/9) * TOTAL=5/9 * TOTAL
However, unlike the above, we found that there are two specifications of the cabinet in the figure: #1-#9 is 200*50, and #10-#12 is 100*50.
In this case, the correct loading calculation in the above figure is:
(200 * 50) * 9 + (200 * 50) * 3
Instead of:
(200 * 50) * 9 + (100 * 50) * 3
Based on the above, the two layouts in the following figure have the same maximum loading capacity.
¶ Projection Calculation
Taking the real scenario of the customer mentioned above as an example, changes in the cabinet coordinates will have an impact on the Ethernet port loading capacity under ultra low latency mode.
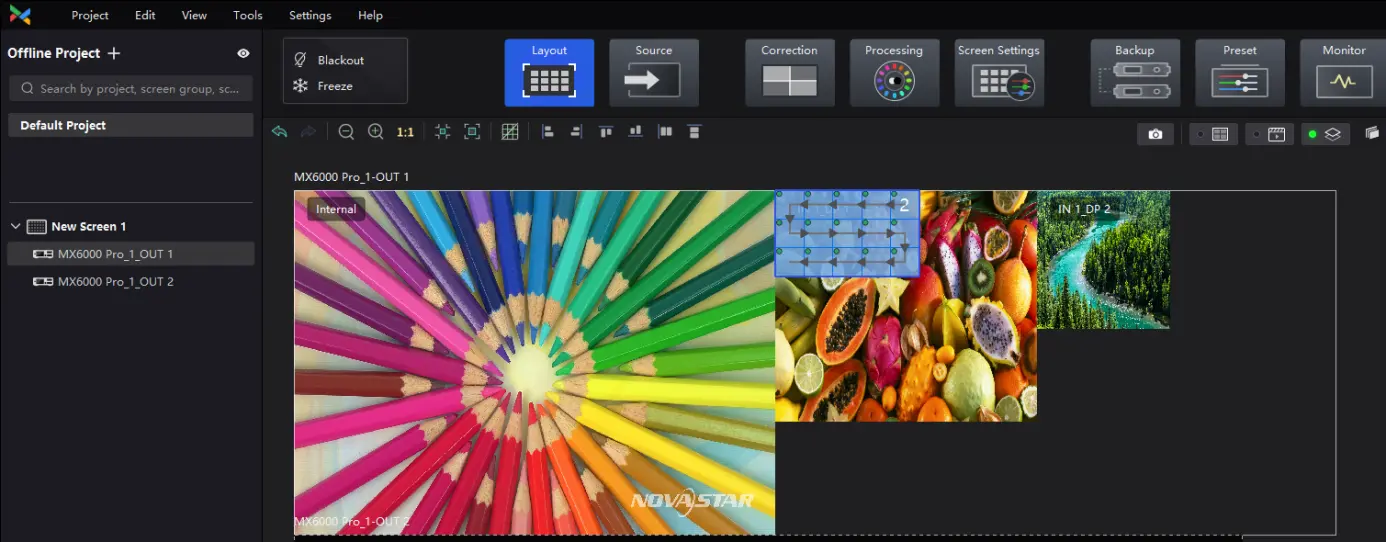
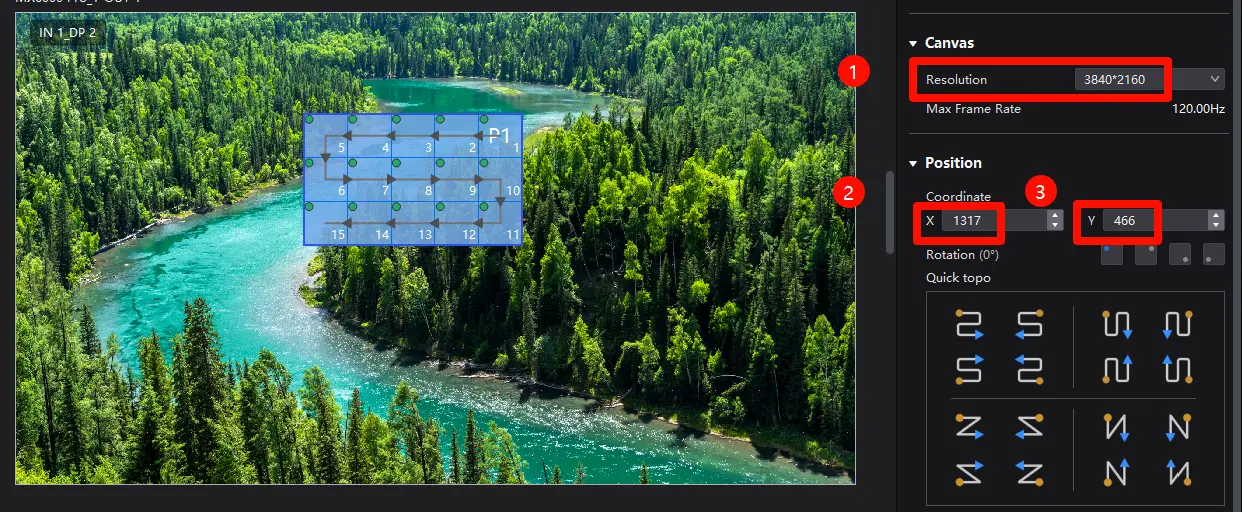
The following image is a screenshot of the actual VMP interface, with a cabinet size of 200*200 and a single cabinet loading capacity of 40000.
At this point, the loading capacity of 15 cabinets under port P1 is 600000.
Through the canvas resolution of the layout interface, it can be known that H=2160 and W=3840 of the canvas at this time.
Through the cabinet coordinates, we can obtain that at this time, under port 1, Y=466, X=1317
Because the port P1 is a 1G Ethernet port, the maximum loading capacity for a single Ethernet port is TOTAL=659722
In ultra low latency mode, the loading capacity of port P1 is
(1- (Y/H)) * TOTAL=(1- (466/2160)) * 659722=0.784 * 659722=517393
The resolution of 15 cabinets is 600000, which is greater than the maximum loading capacity of 517393 of a single Ethernet port in ultra low latency mode. Therefore, once the ultra low latency mode is enabled at this time, the screen display will start to flicker due to overloading.
Note:
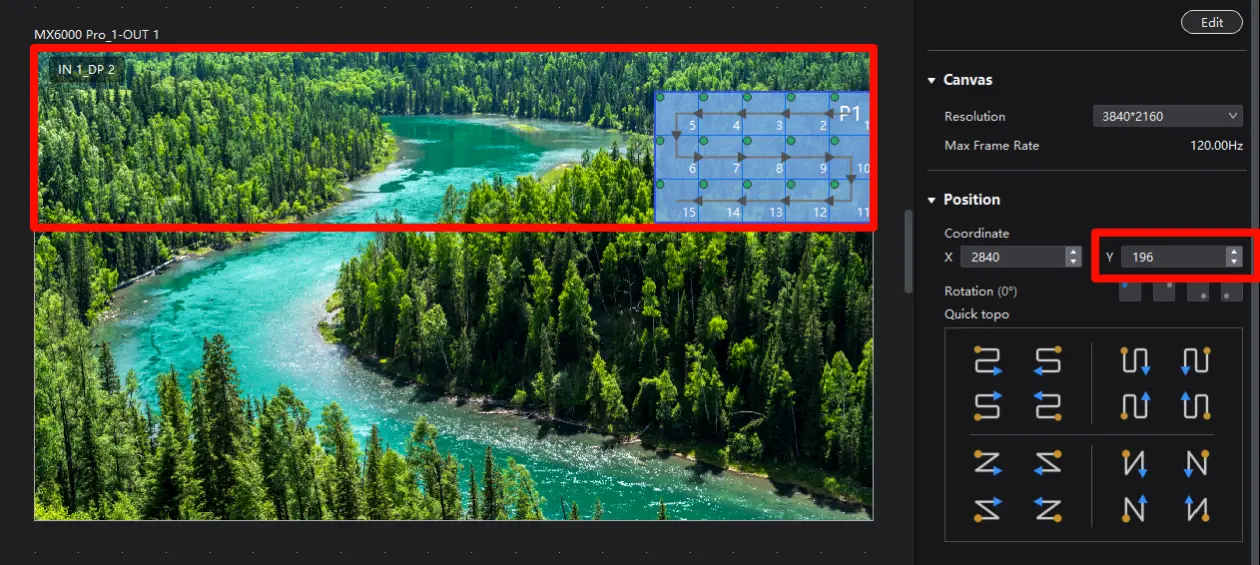
Through this formula, we can further know the movable area of the cabinet coordinates of P1 in the same scenario.
Given that the loading capacity of the port P1 is (1- (Y/H)) * TOTAL
Then Y=(1- (the loading capacity required by 1 Ethernet port/TOTAL)) * H
Since we need the loading capacity for 15 cabinets is 600000, TOTAL=659722, H=2160, W=3840; then:
Y=(1- (the loading capacity required for 1 Ethernet port/TOTAL)) * H
Y=(1-(600000/659722))* 2160
Y= 196
And since the X coordinate of the cabinet does not affect the loading capacity in ultra low latency mode, the movable area of the cabinet under P1 on the canvas is shown in the following figure.
We consistently enhance and refine the content of our Wiki articles.
If you find any mistakes or errors, please contact us.
Your continuous feedback and support will help us further improve our products and content.